Data Visualization Services
See your data in a new light. Our digital data visualization services convert your raw data into meaningful visual assets and stories. We can provide you with the clear insights needed to identify opportunities, mitigate risks, and future-proof your ops.
-
Top 1%
of software development companies on Clutch
-
EU GDPR
commitment to security & privacy
-
60%
of business is based on customer referrals
-
ISO 27001
data security certification by Bureau Veritas
-
 EY EoY 2023
EY Entrepreneur of the Year in West Sweden
Unleash your data's power with our data visualization consulting services:
Are you drowning in spreadsheets and struggling to extract knowledge from your data? Many businesses feel overwhelmed by the sheer volume of information they collect. Investing in data visualization can help you transform raw data into actionable intelligence. Here are key situations where data visualization becomes indispensable:
-
When Your Data Needs Clarity
If you’re dealing with multi-dimensional datasets, intricate relationships, or large volumes of information, visualizing it can reveal patterns and correlations that would be impossible to discern from tables alone.
-
-
When You Want to Communicate Effectively
Presenting raw data can be confusing and fail to resonate with stakeholders. Correct visualizations translate complex findings into easily digestible stories
-
When You Seek Trends and Anomalies
Data visualization excels at highlighting emerging trends and unexpected patterns that might be missed in traditional data analysis.
-
When You Strive to Monitor KPIs
Visual dashboards provide a real-time data visualization of metrics and key performance indicators (KPIs) and allows for quick assessment of progress.
Visualize your data with Beetroot:
What We Design
Our team designs custom visualization solutions that transform your raw data into strategic assets. We create visually interactive tools, be it executive dashboards, detailed analytical tools, or presentation-ready visuals that communicate complex insights clearly. We work with:
-
Interactive Data Dashboards
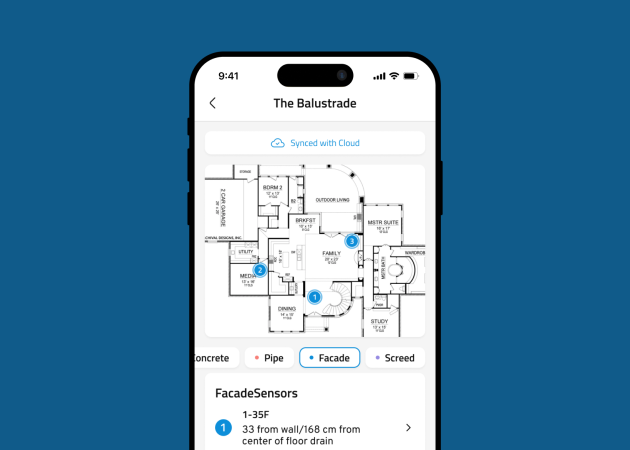
Real-time real-time data visualization of critical metrics and KPIs, which allow users to drill down into specific data points for deeper analysis and informed decision-making. These empower you to monitor performance and identify areas for improvement at a glance.
-
Executive Summaries & Infographics
Visually engaging summaries of key findings and complex information, presented in a concise and easily digestible format for leadership and broader audiences. These are perfect for communicating strategic insights and highlighting key achievements.
-
User Journey Maps
Visual representations of the steps a user takes to interact with your product or service, highlighting pain points, opportunities for improvement, and key touchpoints. Understanding the user experience visually allows for targeted optimization efforts.
-
Customer Segmentation Visualizations
Clear graphical depictions of different customer groups based on shared characteristics, crafted through a marketing data dashboard and personalized customer experiences. These help you understand your audience better and tailor your strategies accordingly.
-
Supply Chain Mapping
Visual representations of your supply chain network, illustrating the flow of goods, materials, and information, identifying potential bottlenecks and areas for optimization. This provides a holistic view of your operations for improved efficiency and resilience.
-
Comparative Analysis Charts
Side-by-side visual comparisons of different datasets, time periods, or categories, making it easy to identify trends, outliers, and performance differences. These are crucial for benchmarking, performance evaluation, and identifying areas of strength and weakness.
Start your data visualization project:
Tools & Technologies
We use our expertise in Tableau data visualization consulting, comprehensive Power BI data visualization services, and the powerful flexibility of D3.js data visualization to create compelling visual narratives. We design intuitive Looker Studio dashboards for accessible insights and deliver robust Qlik data visualization solutions.
-
Design & Prototyping
-
Figma
-
Adobe XD
-
Sketch
-
-
Frameworks & Libraries
-
Bootstrap
-
Tailwing CSS
-
React.js
-
-
CMS & Platforms
-
WordPress
-
Webflow
-
Drupal
-
-
Testing & Optimization
-
Google Lighthouse
-
BrowserStack
-
PageSpeed Insights
-
-
Version Control
-
GitHub
-
GitLab
-
Bitbucket
-
Cooperation Models
We’ve got you covered in anything from design system development and UX audit services to web design services.
-
Dedicated Development Teams
Direct communication and controlExtend your in-house capabilities with a focused team of our visualization experts, working exclusively on your projects. Enjoy seamless integration and consistent progress.
-
Project-Based Engagements
End-to-end supportEntrust your specific data visualization needs to us, from initial consultation to final delivery. We handle the entire process, providing tailored results.
-
Custom Tech Training
Hands-on team trainingElevate your team’s data skills with workshops adjusted to your challenges and data. Learn practical visualization skills and best practices relevant to your specific context.
Tangible Outcomes for Your Business
Our data visualisation services translate your data into clear insights you can readily use. You can expect tangible outputs designed for immediate value and long-term understanding. We also work with design system services and website redesign services. Typical visualization deliverables include:
-
Interactive Data Dashboards & Reports
-
Custom Chart and Graph Design
-
Data Visualization Style Guides & Templates
-
Embedded Visualizations for Applications
-
Training & Documentation Materials
Meet your team of data visualization consultants
Get acquainted with the talented individuals who will illuminate your data.
Our Data Visualization Process
We believe that effective data visualization isn’t one-size-fits-all. Our process is a collaborative journey, adapted to your data, goals, and audience. We ensure the final visuals resonate and drive meaningful understanding.
-
Discovery & Requirements Gathering
We conduct thorough stakeholder interviews to understand your data sources, business questions, and target audiences.
-
Data Assessment & Strategy
Our experts evaluate your existing data architecture and develop a visualization strategy aligned with your business objectives. We offer data pipeline to dashboard solutions.
-
Design & Prototyping
We create initial wireframing & prototyping for stakeholder feedback and iterative refinement.
-
Development & Integration
Our technical team builds production-ready visualizations and ensures seamless integration with your existing systems.
-
Testing & Optimization
We rigorously test all visualizations across devices and platforms, optimizing for performance and user experience (UX) research.
-
Implementation & Training
We deploy the final solution and provide comprehensive training to ensure your team can leverage its full capabilities.
-
Testing & Optimization
We offer continued assistance and periodic reviews to help your visualization assets evolve alongside your business needs.
Data Visualization Services vs. Data Storytelling
While often intertwined, data visualization and data storytelling serve distinct purposes. Data visualization focuses on presenting data in a clear and accessible visual format to reveal patterns and insights. Data storytelling and infographic design go a step further by weaving those visuals into a narrative, and provides context, explanation, and ultimately drives understanding and action.
-
Data Visualization
- Prioritizes the precise and unbiased representation of data
- Encourages users to independently explore data
- Presents data in a visual format that allows for manipulation and filtering
-
Data Storytelling
- Organizes visualizations within a story framework
- Aims to captivate the audience and convey a specific point of view
- Combines custom chart and graph design with textual explanations and annotations
Drive business growth with data:
Data Visualization for Your Industry
Our expertise allows us to craft solutions that address the unique challenges and opportunities within specific sectors. We offer user-friendly data visualization solutions for a range of industries, including:
-
HealthTech
Visualize patient data, treatment outcomes, operational efficiency, and research findings in a comprehensive healthcare data dashboard.
-
GreenTech
Track environmental impact, renewable energy generation, resource management, and sustainability metrics for informed decision-making and progress monitoring.
-
E-commerce
Analyze customer behavior, create sales and KPI dashboards, track marketing campaign performance, and inventory management and enhance customer experience
-
FinTech
Visualize market trends, investment portfolios, risk management data, and performance with clear financial data visualization.
-
Manufacturing
Monitor production processes, supply chain efficiency, quality control metrics, and equipment performance for optimized operations and reduced downtime.
-
Logistics
Visualize transportation routes, delivery times, inventory levels, and network optimization to improve supply chain visibility and operational efficiency.
Explore our visualization capabilities:
Why Choose Beetroot as a Data Visualization Company
When you choose among various data visualization service providers, experience and expertise matter — but approach and values are equally important. We bring 12 years of experience, coupled with a client-centric approach and a commitment to sustainability. We believe in building lasting partnerships based on transparency, collaboration, and shared values. While working with us, you get:
-
Sustainable Design
Commitment to green UX principles that create energy-efficient visualizations with optimized rendering and reduced computational requirements.
-
Tangible Results
Proven expertise across both technical implementation and strategic business consulting. We make visualizations that solve real business problems .
-
Tailored Solutions
Custom-built solutions tailored to your specific business needs rather than generic templates or one-size-fits-all approaches (check out our landing page design services).
-
Continuous Partnership
Dedicated support team that ensures seamless integration and provides ongoing assistance as your data needs evolve.
-
Enterprise-Grade Security
Data security and compliance focus with stringent protocols that protect sensitive information throughout the visualization process.
-
Accelerated Results
Rapid time-to-value methodology that delivers initial insights quickly while building toward comprehensive visualization systems.
Our Clients Say
Explore our client success stories and see our expertise in action.
Beetroot in Action
From startups to enterprises, we’ve helped numerous companies achieve their goals. Here are a few examples of our work:
Custom Workshops
We offer specialized training programs designed to empower your team to leverage data visualization effectively within your organization. As a result, you can:
-
Equip your team to create, modify, and interpret visualizations independently
-
Establish organization-wide standards for data presentation
-
Make sure everyone can extract insights from your visualization tools and platforms
Make sure everyone can extract insights from your visualization tools and platforms:
Discover how our data visualization solutions can reveal valuable opportunities. Fill out the form and we’ll get back to you to schedule a consultation.


