


Contents
Contents
The gap between an agent that impresses in a demo and one that holds up in production is wider than most teams expect on launch day. Real conditions bring ambiguous requests, live tool integrations, and data that shifts without notice, and an agent can handle the demo script perfectly while failing quietly on all three.
AI agent evaluation is how you define what “holding up” means for your workflow before launch, and monitoring AI agents in production is how you confirm it afterward. Below, we cover what to measure at each stage, and how production failures become the test cases for your next release.
Why AI Agent Evaluation Differs From Testing Traditional Software
Traditional software tests typically compare an output against an expected result. AI agent evaluation also has to account for nondeterministic outputs and execution paths that differ between runs while all being valid. That gap is where prototypes stall on the way to production.
Your existing test suite still matters, and uptime and error rates need the monitoring they always did. What that layer cannot tell you is whether the agent completed the right task, or spent five tool calls on work needing two.
Gartner predicted in June 2025 that over 40% of agentic AI projects would be canceled by the end of 2027, citing escalating costs, unclear business value, and inadequate risk controls. Each of those becomes measurable once success has been defined for a specific workflow.
A Successful Response Can Hide a Failed Process
An agent can return a fluent, plausible answer while working from a stale source or skipping a required approval. Nothing in the final text signals either one.
OpenAI’s guidance on evaluating agent workflows treats the trace as the end-to-end record of model calls, tool calls, guardrails, and handoffs for a single run, then grades that record against questions like whether the agent picked the right tool and whether a handoff happened when it should have.
Agent Performance Depends on More Than the Model
A capable model does not guarantee a capable agent. In custom agentic AI development, the working system also includes system instructions, orchestration logic, retrieval and memory, tools and their permissions, and the human review around them. Any one of them can be the component that fails.
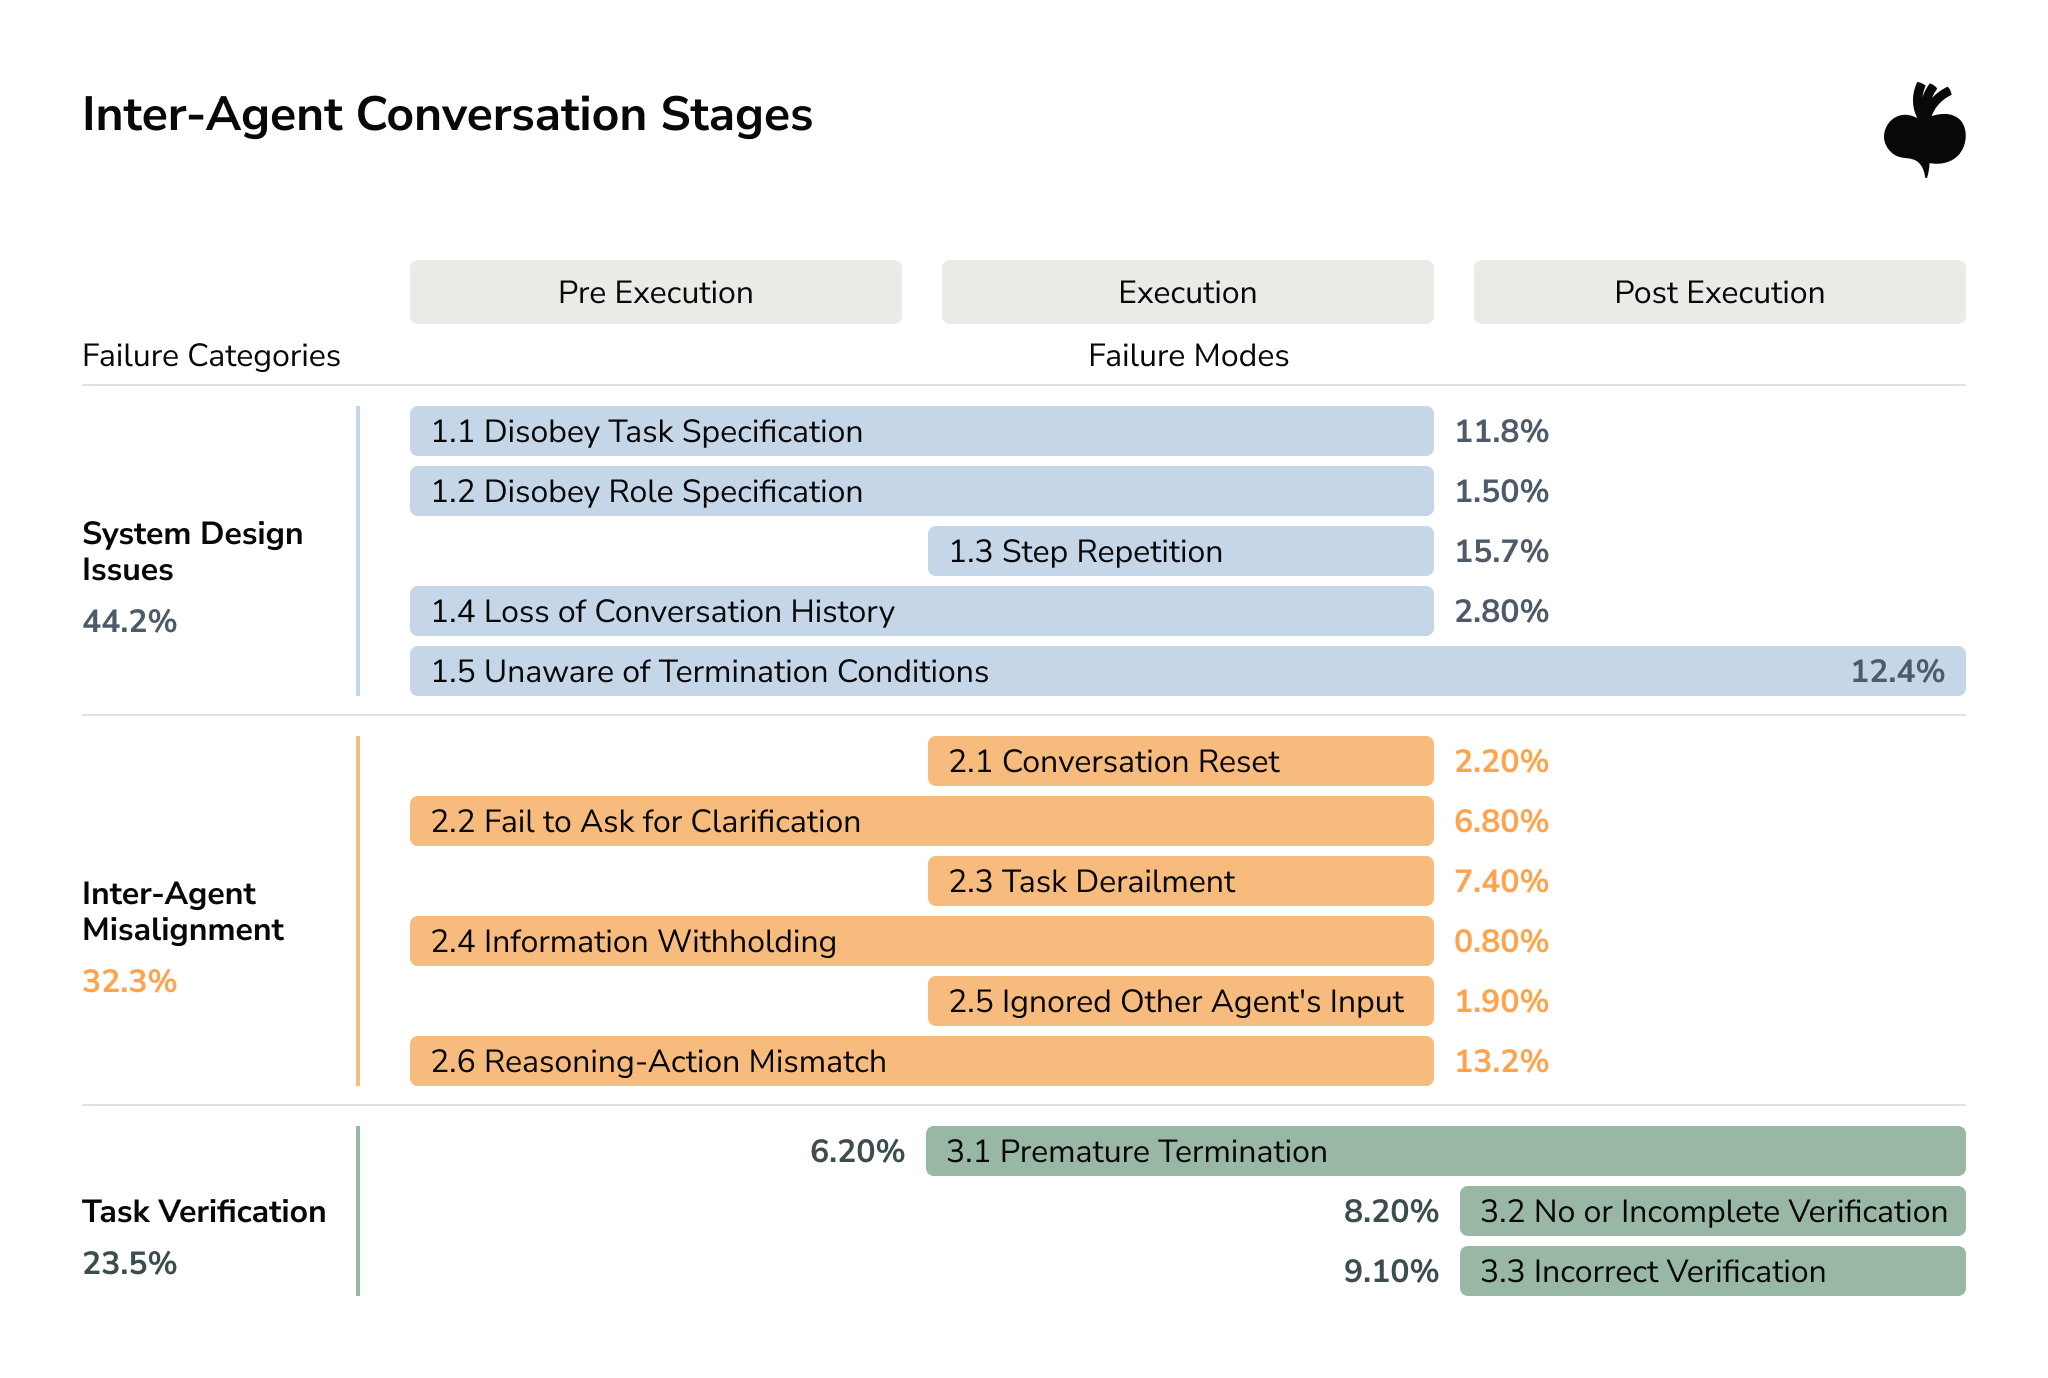
When production agents fail, the model is rarely the whole story. A study of over 1,600 execution traces across seven multi-agent frameworks found the failures clustering into three groups: how the system was designed, how agents coordinated with each other, and whether anyone verified the task was actually done. A stronger model alone does not address these failure modes.
AI Agent Evaluation Metrics That Reflect the Business Outcome
Useful AI agent evaluation starts from the workflow the agent runs and the consequence of getting it wrong. Four groups of evaluation metrics carry most of the weight: outcome, execution, efficiency, and risk.
Task Success and Outcome Metrics
Task success rate is the closest to business value, and it means something only once you define success for the workflow. Resolving an eligible support request correctly, updating the right record, and declining a prohibited action are all workable definitions. A generic accuracy score leaves too much unstated to act on.
Microsoft Foundry’s observability documentation lists task completion and tool call accuracy among its agent-specific evaluators, alongside groundedness and relevance for retrieval-based answers. Those categories are worth borrowing even if you never touch the platform.
Trajectory Evaluation and Tool-Call Accuracy
When an agent can act, the path matters as much as the answer. Trajectory evaluation compares the sequence of tool calls the agent made against the sequence you consider correct.
Google Cloud’s Gen AI evaluation service scores exact match, in-order match, and any-order match against a reference trajectory, plus precision and recall over tool calls. Precision drops when the agent takes unnecessary steps. Recall drops when it skips an essential one.
Use trajectory or execution trace for the observable sequence of calls and state changes; reasoning trace implies a faithful record of internal deliberation, and evaluation should not depend on having one.
Cost, Latency, and Efficiency Metrics
Cost per successful task shows what the workflow costs to run. A run that costs more and completes a valuable task can still be the cheaper option once you count the retries and escalations sitting behind a lower per-call price.
Google’s evaluation service adds latency and a failure flag to agent results by default, which covers part of the operating picture without extra instrumentation. Track steps per task alongside latency benchmarking, since a rising step count often shows up in cost before it shows up in output quality.
Safety, Policy, and Escalation Metrics
Risk metrics should follow the consequence of the action. A low-volume route that can move money deserves closer watching than a high-volume one that only reads, so permission failures and reviewer overrides often say more than an aggregate quality score.
Escalation accuracy is worth tracking in both directions: cases escalated that reviewers waved through, and cases handled automatically that reviewers would have stopped. AI safety guardrails belong here as a measured control, since a blocked request produces a signal and whether the block was correct remains a separate question.
How Do You Build an AI Agent Testing and Evaluation Pipeline Before Launch?
A predeployment pipeline turns business goals into scenarios, scoring methods, and thresholds a release has to clear. That pipeline is what separates a demo from a production-ready AI implementation. AI agent testing covers the wider work around it: functional and integration tests, security tests, load tests, and regression suites. Evaluation adds a layer without replacing any of it.
Define Success and Failure Before Choosing Metrics
Start with the task and the outcomes that are prohibited outright. The same success rate can be acceptable in one business and unacceptable in another, and what separates them is the cost of the failures. That belongs in the criteria before anyone picks a metric.
Build an Evaluation Set That Reflects Real Conditions
A representative evaluation set covers common tasks plus the cases most likely to break: ambiguous inputs, tool timeouts, adversarial prompts, and edge cases drawn from real workflow conditions. A set that always passes still catches regressions, though it stops telling you where to improve.
Combine Deterministic, Model-Based, and Human Evaluation
Use exact checks wherever the correct answer is knowable, such as whether the right record was updated and whether the tool arguments validated.
LLM-as-a-judge scores the qualities that resist exact rules, such as relevance or completeness. Validate it against human annotations or business rules before you rely on it as a release gate. OpenTelemetry’s GenAI semantic conventions now define attributes for an evaluation’s name, score, and explanation, which keeps judge output traceable alongside everything else.
Make Evaluation Part of Release and Regression Testing
Set the thresholds that gate a release, then rerun the critical scenarios whenever a model version, prompt, tool, retrieval source, or policy changes. Agents degrade from changes that have nothing to do with the model.
Microsoft’s documentation describes wiring the same evaluators into CI/CD and into production monitoring, so a score carries the same meaning in both places. That consistency makes a threshold defensible three releases later.
Monitoring AI Agents in Production: What Changes After Launch
AI agent performance monitoring answers a narrower question than evaluation. Is the agent still performing inside the range you agreed on, and has anything moved? Continuous monitoring answers it with telemetry from real traffic, sampled evaluations of live interactions, and direct user feedback.
AI Agent Observability: What a Useful Trace Contains
AI agent observability is the ability to reconstruct why a run behaved the way it did. A useful trace lets you replay the run: the request that arrived, what retrieval returned, which tool was called with which parameters, which policy checks fired, and what the agent sent back. Latency and token usage attach to each step. LLM observability at the single-call level is one part of that picture.
The OpenTelemetry GenAI semantic conventions are the closest thing to a shared vocabulary, defining attributes for agent, tool, retrieval, and evaluation data so traces stay readable across backends. They remain marked as in development and have moved to a dedicated repository, so pin your instrumentation version and keep attribute names behind a thin mapping layer.
AWS organizes Bedrock AgentCore observability into sessions, traces, and spans, and its evaluation API accepts session spans in OpenTelemetry format. Deciding where instrumentation belongs gets easier once you can see which components emit which signals, which is what our walkthrough of how AI agents work inside enterprise systems lays out.
Detecting Drift Without Calling Everything a Hallucination
Understanding why AI agents fail in production starts with separating the failure types. Hallucination is a specific one: unsupported or fabricated generated content. Wrong tool selection, a failed API call, stale retrieval, and an incomplete task are different problems with different fixes, and one label for all of them sends teams to the model when the defect is in the workflow.
Separating the types matters across generative AI integration and implementation more broadly, since a chat assistant fails in the same distinguishable ways.
Drift needs naming too. Say what changed: user inputs, the knowledge source, a tool’s API, or the model version.
Microsoft Foundry runs scheduled evaluations against test datasets to detect system drift, separately from continuous evaluation of sampled live traffic. Detection shortens the time before someone looks, and a flagged decline still needs investigation before anyone changes a prompt.
Alerting and Human-in-the-Loop Escalation
An alert earns its place when it has an owner and a defined response. Set severity levels, name who investigates, and agree the conditions under which the agent stops acting and hands over.
Sampling should follow risk, so a high-value action or an unusual trajectory deserves more scrutiny than repetitive, low-risk traffic. Designing the review policy itself, deciding who approves what and at which risk level, is a separate exercise; reading about human-in-the-loop workflows in agentic AI can help shape it before you set monitoring thresholds. The point specific to monitoring is narrower: escalation rates and reviewer overrides are evaluation signals in their own right.
Turn Production Failures Into New Evaluation Cases
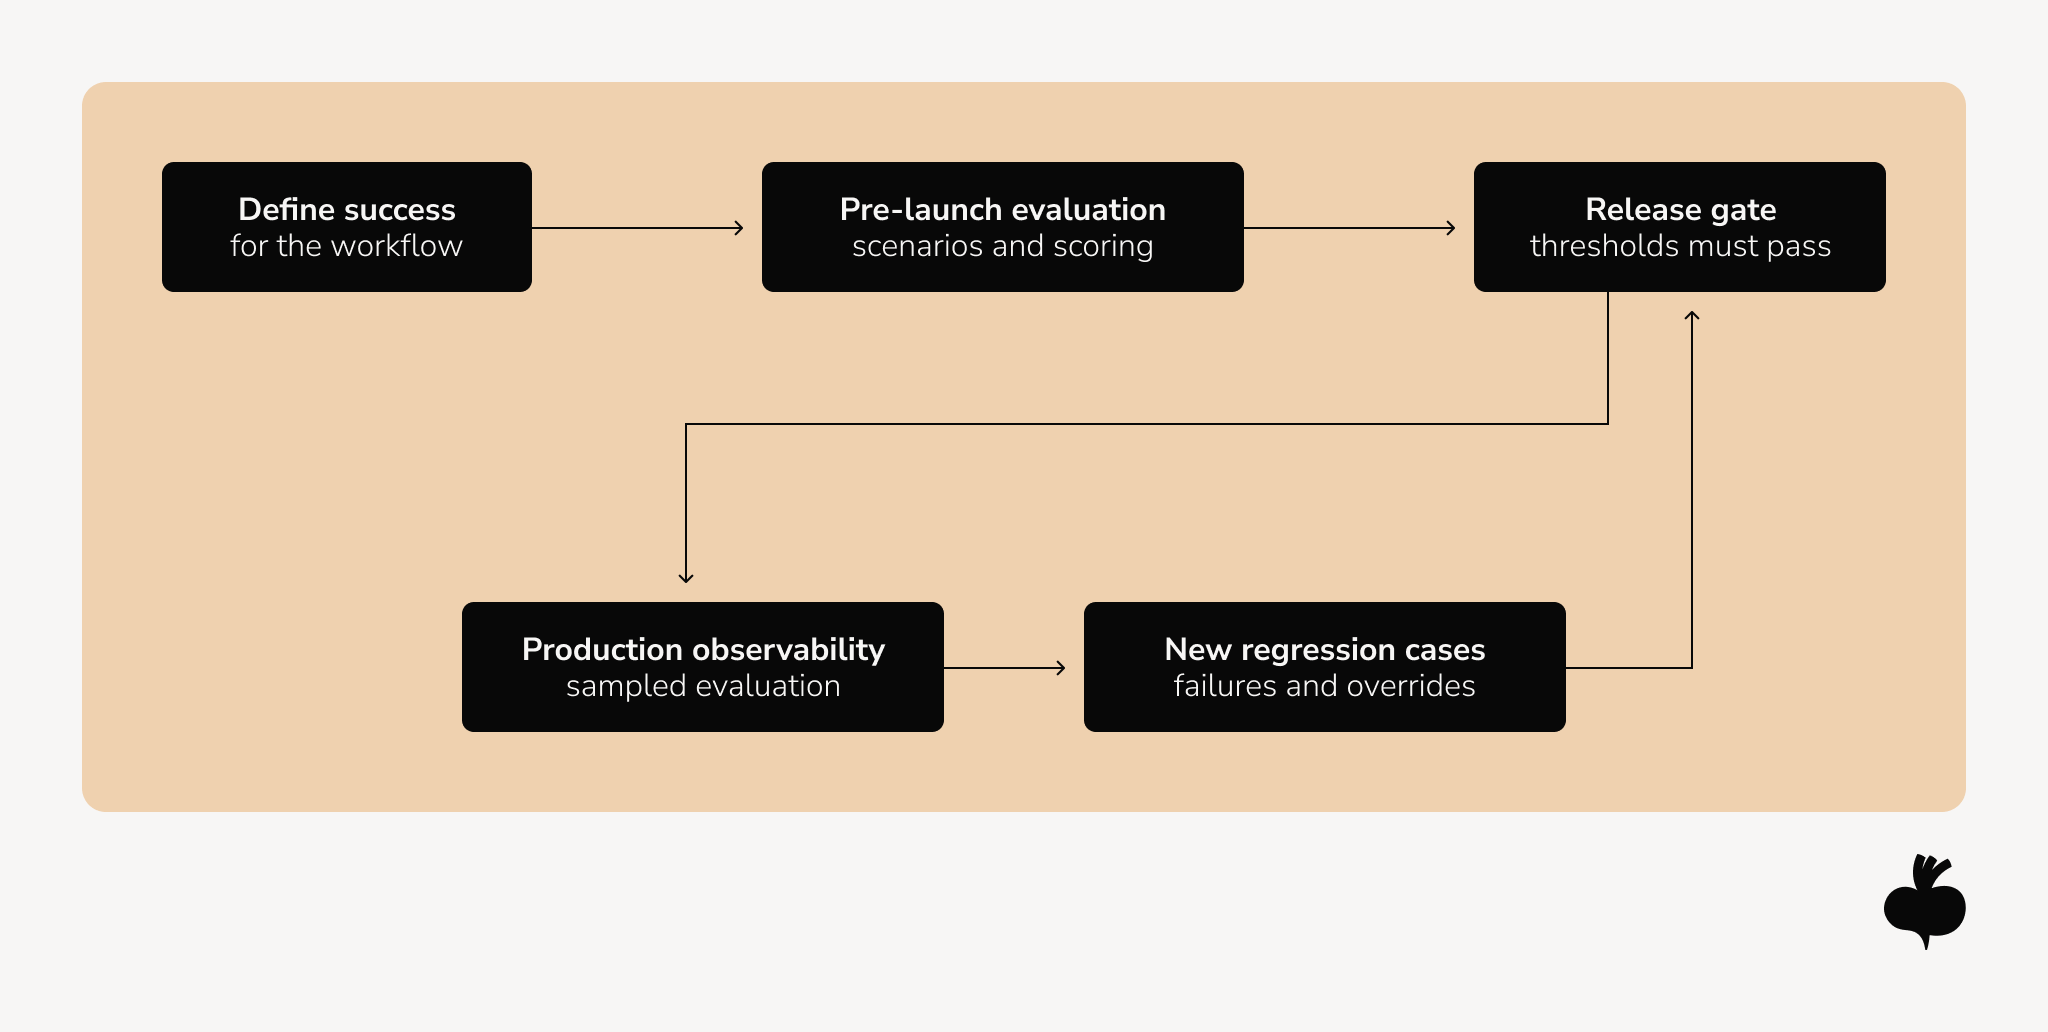
Every incident, failed trace, and reviewer override is a candidate regression case. Adding it to the evaluation set closes the loop between what production taught you and what the next release must prove. This step is easy to skip when the evaluation set was built once, for launch, and never given an owner.
How Do You Choose AI Agent Monitoring Tools and an Observability Stack?
No single platform covers every requirement, and the right combination depends on what you already run. Observability frameworks tend to be assembled rather than bought: application performance monitoring for infrastructure health, OpenTelemetry instrumentation for the agent layer, an evaluation layer for quality and safety scoring, and custom business metrics for task success.
Questions worth answering before you commit to observability tools for AI agents in production:
- Does the tool evaluate the complete workflow, or only model outputs?
- Can it ingest telemetry you already emit, or does it need its own SDK everywhere?
- Where does trace data live, and what does that mean for residency and retention?
- Can the same evaluators run in CI and against production traffic, so scores stay comparable?
Continuous evaluation of live traffic adds cost on the platforms that offer it, which makes sampling rate a design decision. If you’re weighing where an evaluation layer fits alongside existing pipelines, exploring MLOps use cases for production AI can help place these components before you commit to a vendor.
Governance, Security, and Ownership in Agent Monitoring
What you can safely log, evaluate, and automate is shaped by ownership, access, privacy, and retention decisions that sit outside the engineering team.
Observability Data Can Be Sensitive
Traces carry prompts, outputs, retrieved content, tool parameters, and often user identifiers. OpenTelemetry’s conventions flag the message attributes as likely to contain sensitive information, including personal data, and recommend that instrumentations provide a way to filter or truncate them.
Decide what to keep before you switch instrumentation on: full payloads for a short window, structured metadata for longer, redaction in the collector for anything crossing a boundary. Data quality assurance for AI systems belongs in the same conversation, because the data feeding your evaluation set often feeds retrieval too.
Monitor Actions as Well as Outputs
An agent with tool access needs evaluation of what it attempted and what it was permitted to do, alongside the downstream effect of anything it completed. Reversibility matters here, since an action you can undo carries a different risk profile from one you cannot.
OWASP’s Top 10 for Agentic Applications, published in December 2025 with input from more than 100 contributors, places tool misuse and identity and privilege abuse near the top of its list, alongside memory and context poisoning.
Those map onto monitorable events, including calls attempted outside a permission boundary and writes to memory that later change behavior. Working through a security checklist for autonomous AI agents before launch helps confirm the controls exist; the monitoring question that remains is whether you would see a violation, and how soon.
Define Ownership and Response Procedures
Production readiness comes down to who owns what. Name an owner for the evaluation criteria and an owner for production thresholds and incident response, then make the release decision an explicit responsibility. Those owners rarely sit in one team, so write down the handover points between engineering, security, and the business owner early.
What to Do Differently on Your Next Agent Release
- Write the success definition before the metric. Write down the task, the failures you refuse to ship, and who signs off on both.
- Evaluate the trajectory as well as the answer. Score tool selection and recovery from failure alongside the final output, so an articulate wrong answer becomes visible.
- Measure cost per successful task. Token spend alone hides an agent that retries its way to an acceptable result.
- Sample by risk. Set a higher review rate for actions that move money or cannot be undone, and review unusual trajectories in full.
- Give every alert an owner and a next step. Put the severity levels and the first response in the runbook, so the person on call knows what to do with it.
- Feed production failures back into the evaluation set. Add each incident and reviewer override as a regression case in the same sprint, while the trace is still available.
Production Reliability Comes From Continuous Evaluation
An agent earns the description “reliable” when four things hold together: success is defined for the workflow, evaluation covers outcomes and execution paths, production behavior is observable, and failures return to the evaluation set as new cases. Without that loop, a passing benchmark only describes the day it was run.
We work with teams at the point where an agent has to move from a working prototype into a controlled production environment. Depending on scope, that means defining evaluation criteria around a workflow, instrumenting agents for tracing, or adding AI, MLOps, and QA expertise to a team that already owns the product. If you’re deciding what to measure before your next agent release, let’s talk.
FAQs
What metrics are most important for AI agent evaluation?
AI agent evaluation metrics fall into four groups: task success for the outcome, trajectory and tool-call accuracy for the execution path, cost and latency per successful task, and safety signals such as policy violations. No single agent score covers all four, so the metric set should follow what the agent is expected to do and what a failure costs.
How is AI agent observability different from traditional software monitoring?
AI agent observability captures the execution path of a run, including model calls, retrieval events, tool selection and parameters, state changes, and the final output. Traditional software monitoring tracks availability, latency, and infrastructure errors, all of which an AI agent can pass while still completing the wrong task or violating a workflow rule.
How should teams monitor AI agents in production?
Monitoring AI agents in production combines end-to-end traces of real traffic, continuous evaluation of a sampled share of interactions, and alerts tied to a defined response. Beetroot builds evaluation, tracing, and escalation capabilities around a defined agentic workflow when that work is in scope, so production behavior stays open to investigation after launch.
When should an AI agent escalate a task to a human reviewer?
An AI agent should escalate when an action is consequential or hard to reverse, and when a policy check or grounding threshold flags the request. Escalation rules belong to the specific workflow, and recording reviewer decisions lets teams evaluate escalation accuracy over time. Beetroot implements human-in-the-loop escalation for high-risk or uncertain cases as part of an agreed engagement scope.
How can teams reduce AI agent latency and cost without lowering task success?
AI agent latency and cost depend on steps per task, retries, model choice at each step, and how much context every call carries. Reducing unnecessary steps and caching stable context usually moves both figures before a smaller model does. Any change should be rerun against the evaluation set to confirm that task success is maintained.
Subscribe to blog updates
Get the best new articles in your inbox. Get the lastest content first.
Recent articles from our magazine





Contact Us
Find out how we can help extend your tech team for sustainable growth.