AI Crop Disease Detection: From Field Imagery to Product Feature
- November 14, 2026
- 10 min read
- AgTech
- Green Tech

Contents
Contents
A crop disease detection model that performs well on a public benchmark is a reasonable starting point for an AgriTech product. The harder work begins when the same model has to handle your growers’ fields and cameras. Below, we walk through what custom computer vision development involves when disease detection has to work outside the lab.
How AI Crop Disease Detection Fits Into Modern AgriTech
AI crop disease detection is a computer vision capability that flags visible disease symptoms in crop imagery. It is one part of crop monitoring, which also covers plant counts, weeds, water stress, and pest damage.
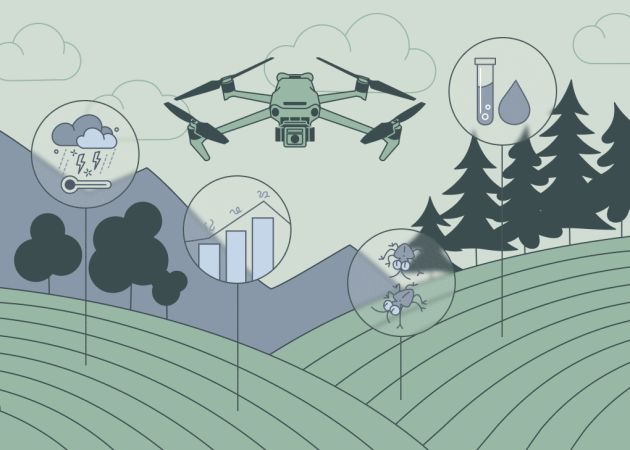
Products that combine crop monitoring and disease detection draw on images from phones, field cameras, drones, or machinery. The value of computer vision in agriculture here is coverage: the system can help teams screen more plants and direct scouts to the places worth checking first. For the wider picture, see our overview of AI applications in precision agriculture.
What Computer Vision Can Detect
A model can classify images into known conditions, locate lesions or affected plants, estimate visible severity, and flag unusual patterns.
The important constraint: a visual match is not a diagnosis. Nutrient deficiency and several diseases can look alike, and confirming the cause may need a scout or a lab test. Labeling outputs as suspected disease, with a confidence score, helps set accurate expectations.
Where the Detection Goes Next
A detection becomes useful once it lands where a person or system can act on it: a mobile alert, a geotagged observation, a crop-health map, or a ranked scouting list. FAO’s early warning systems for plant health follow this pattern at scale, with field observations logged on phones and uploaded to a platform that maps pest spread.
For planning, define where each detection will go before choosing a model, because the destination decides the output format.
How Crop Disease Detection AI Works
Crop disease detection AI relies on four common computer vision tasks. Each produces a different output, so start from what your product needs to show the user and work back to the task. Picking an architecture first tends to lead to rework once the requirement becomes clear.
Image Classification
Image classification assigns a whole image, or an isolated leaf, to one known category. It fits a crop disease detection app where a grower photographs a single leaf and receives a likely condition. Annotation stays simple, since each image needs one label. Its limit is spatial: the model reports what the image likely contains without saying where.
Object Detection
Object detection finds affected leaves or plants within a wider frame and marks each with a bounding box. It suits images from fixed cameras or drones, where one frame contains many plants, and the software needs to know which ones to flag. Boxes also make counting and geolocation simpler.
Image Segmentation
Image segmentation labels individual pixels, outlining the exact area that shows symptoms. It fits products that estimate disease severity, such as the share of leaf area affected, often through leaf lesion segmentation. Pixel-level annotation takes longer than drawing boxes, so reserve it for cases where area measurement drives a decision.
Anomaly Detection
Anomaly detection learns what healthy crops look like and flags images that deviate from that baseline. It helps when the list of possible diseases is incomplete or some conditions have too few examples for a dedicated class. The output is a prompt for review, so pair it with a human check.
Products can combine tasks, such as a detector that finds leaves and a classifier that labels each one. Choose the simplest combination that produces the output your users will act on.
What Makes a Crop Disease Detection System Custom?
A custom system adapts proven models to your field data and product setup. Crop disease detection using AI often does not require inventing a new neural network architecture.
Transfer learning, a technique that starts from a model already trained on large image collections, reduces the labeled field data needed for machine learning for crop disease detection. Customization then happens around the model, in its training data and thresholds and in how results enter the product.
Data That Matches Your Crops and Field Conditions
Training data needs to represent the crops, disease categories, seasons, growth stages, regions, and camera types your customers use. Lookalike stresses deserve the same attention as diseases. If nutrient deficiency appears in the field, it needs to appear in the training set as labeled examples, or the model has no basis for telling it apart.
Product-Specific Outputs and Integrations
A scouting app may need a disease class with a confidence score and GPS coordinates, while a GIS platform may expect polygons with severity values in a defined schema. Designing this output contract early, including coordinate systems and how low-confidence results are marked, reduces the risk that integration work reshapes the model late in the project.
Choosing Between Edge and Cloud Deployment
Edge AI deployment runs the model on the device itself, such as a field camera or a drone’s onboard computer. It suits fields with weak connectivity and use cases that need results within seconds, with trade-offs in model size and in updating models across many devices.
Cloud inference supports larger models and simpler updates, and it fits post-flight drone analysis. A hybrid setup triages images on the device and sends selected frames to the cloud. The deciding questions are how fast results must reach the user and what connectivity is available in the field.
Data Is Often the Hardest Part of Crop Disease Detection
Collecting and labeling representative field imagery can take more effort than any model choice, because production performance depends on how closely training data matches the field.
Public Datasets Are a Starting Point
A public crop disease detection dataset is useful for experimentation and transfer learning. PlantVillage, for example, contains over 54,000 single-leaf images shot against uniform backgrounds, as described in a 2026 study in Frontiers in Plant Science.
In that study, a fine-tuned ResNet-50 image classifier reached 99.73% accuracy on PlantVillage test images and 32.05% on PlantDoc, a set of field photographs, while its average confidence stayed near 80%.
For your product, the confidence figure also matters because a model that is wrong yet confident gives users no reason to double-check. Treat public datasets as material for pretraining, and plan field data collection alongside them.
Annotation Needs Clear Rules
Dataset annotation is the process of labeling images so a model can learn from them, and for disease imagery those labels carry judgment. Your team needs written definitions for each class and for where a lesion boundary ends, because human raters disagree. A tar spot study in Plant Disease notes that severity estimates vary within and between raters.
A model trained on inconsistent labels learns the inconsistency, so guidelines and agreement checks belong in the plan from the first batch. Our guide to building a reliable data annotation workflow covers the setup.
Field Validation Reveals Production Performance
Field validation tests the model on fields, dates, devices, and seasons it did not see in training. Wageningen University & Research measured the effect in a 2025 smart camera study using test images from commercial vineyards and orchards.
The researchers trained detection models on disease images recorded under controlled conditions and tested them in two scenarios. When the models were trained on similar images from the same smart-camera field campaign, they reached an F1 score, a metric that balances missed detections against false alarms, of 66.3% for grape downy mildew and 45.1% for apple scab. When trained on images from commercial fields, where conditions differed from the training data, the scores dropped to 34.8% and 5.5%.
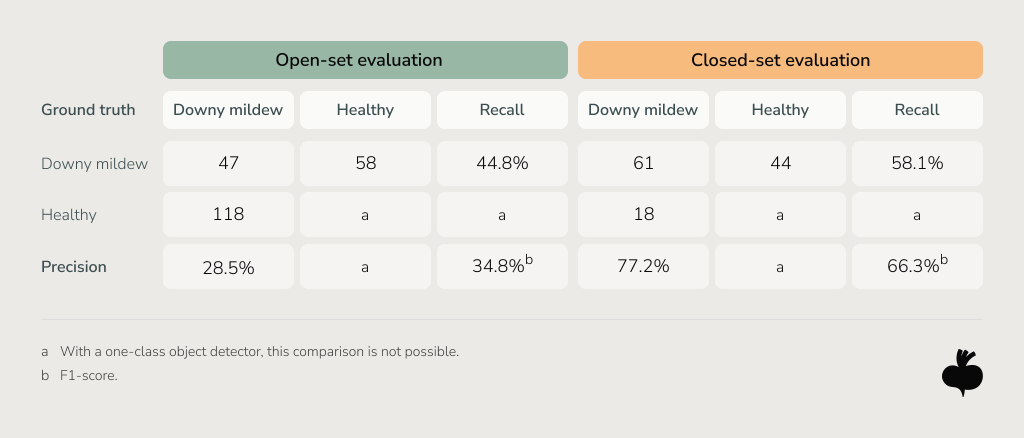
The implication for planning is direct: field validation and representative data should be part of development from the start, since a model tuned on controlled imagery may need substantial rework once it meets commercial fields.
Choosing the Right Imagery and Hardware
Choose the sensor based on the visual information your use case needs and the area you have to cover. Advanced imaging adds cost, so it needs a clear use case.
RGB Cameras and Crop Disease Detection Apps
Standard RGB cameras, including smartphones, capture the visible symptoms growers already scout for. Smartphones need no extra hardware, which makes a crop disease detection app a practical entry point. The main variable is capture consistency, which in-app guidance on distance and framing can improve.
Fixed Cameras and Agricultural Machinery
Cameras on poles, greenhouse rails, robots, or tractors capture images from repeatable positions, supporting continuous monitoring and making changes over time easier to compare. The trade-off is scope, since embedded software and device fleet updates become part of the project.
Drone Crop Disease Detection
Drone crop disease detection extends coverage to whole fields, and drone crop monitoring brings its own constraints. Flight altitude sets ground resolution, so small lesions visible up close can disappear at survey height, and the canopy can hide symptoms on lower leaves.
Every flight also adds geolocated imagery to store and process. Our work with Land Life shows this kind of pipeline in a reforestation context: we developed computer vision algorithms and a data-mining infrastructure that transformed raw drone imagery into structured geospatial data.
Multispectral and Hyperspectral Imagery
Multispectral imagery captures a few bands beyond visible light, such as near-infrared, while hyperspectral imagery records hundreds of narrow bands. Both can reveal reflectance changes that RGB misses, which helps with crop stress detection and some disease use cases.
Spectral sensors also require calibration and generate larger data volumes. A 2024 Wageningen study on drone hyperspectral imaging in maize notes that spectral features respond to plant growth, environmental factors, and disease. Use spectral sensing where the use case clearly needs it.
From Detection to a Usable AgriTech Workflow
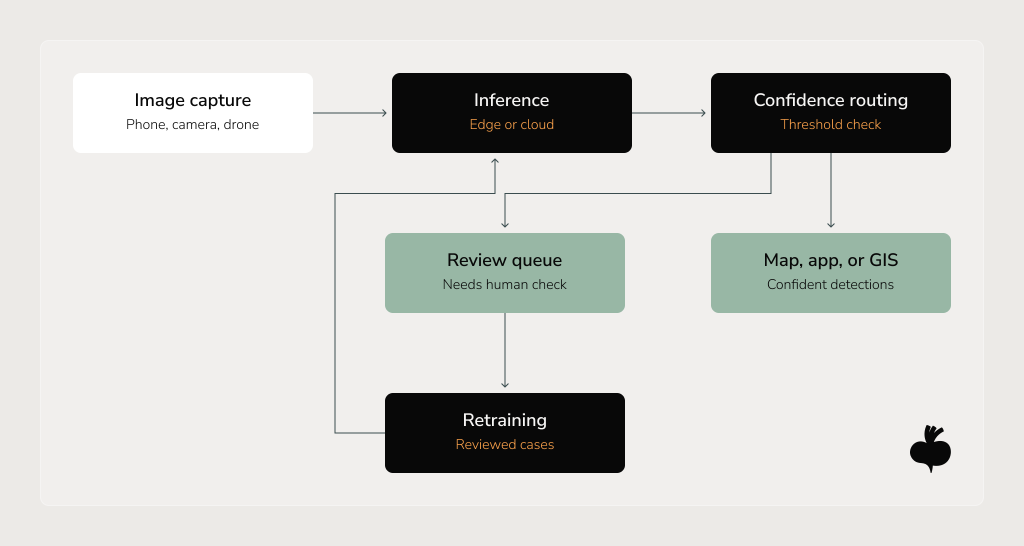
Detections become useful when they reach the people and software responsible for the next step, with clear limits on what the system decides.
Decide What the Model Can Do Automatically
Set confidence thresholds that separate results the system can log on its own from results that need a person to look. Low-confidence and high-consequence findings go to a review queue. Given the confidence figures in the Frontiers study, tune thresholds on field images.
Integrate With Existing Farm Software
Integration means APIs that return structured results, map layers in GIS tools, push alerts in mobile apps, or write records into a farm-management platform. Consistent coordinates, timestamps, field identifiers, and a model version on every result make detections traceable and easier to audit later.
Keep Detection Separate From Treatment Logic
A computer vision signal indicates suspicious symptoms. It does not determine the treatment or the application rate, which depend on confirmed diagnosis, crop stage, weather, and local regulations, and belong to agronomists or approved decision-support systems. In the Wageningen project, detections fed a separate decision-support system.
Write down which decisions your model informs and which it never makes, because that boundary shapes the review workflow and the interface.
Moving From Prototype to Production Crop Disease Detection
A staged path validates one bounded use case before you scale to more crops and sites, with each stage producing evidence for the next.
Step #1: Define the Product Requirement
Specify the crop and disease categories, image source, vision task, expected output, where inference runs, and who consumes the result. A requirement at this level of detail exposes gaps early.
Step #2: Assess Available Data
Audit existing imagery for coverage across seasons, regions, devices, and lookalike conditions, and note missing or inconsistent labels. The gaps define your collection and annotation plan.
Step #3: Build and Validate a Focused Pilot
Keep the pilot narrow, for example, one crop and a small disease set, and test it on fields and dates held out from training. Track false positives and false negatives separately, since a missed infection and an unnecessary scouting trip carry different costs for growers.
Step #4: Integrate the Model Into the Product
Once the pilot meets agreed thresholds, add APIs, deployment, interfaces, and map layers. Test the full chain with real users, because latency and output formats can cause as many problems as the model itself.
Step #5: Monitor and Improve
Model drift is a decline in a deployed model’s performance. One cause is data drift, when incoming images move away from the training data, for example, after customers switch to new cameras. Another is concept drift, when the link between visible symptoms and the correct label changes, as when a newly introduced disease produces symptoms similar to a class the model already knows. Drift can build up across seasons or appear suddenly after a single hardware or pipeline change.
When Does Custom Computer Vision Make Sense?
Custom development makes sense when existing tools cannot meet a concrete product requirement. If a commercial model already covers your crops, disease classes, devices, and integrations, building your own may not pay off.
An off-the-shelf model is a reasonable choice when it supports your crops and performs acceptably on your own validation images, since vendor benchmarks use the vendor’s data. It shortens time to market and moves maintenance to the vendor. Custom work becomes easier to justify in situations like these:
- Coverage gaps. Your crops or disease classes are missing from available models, or regional varieties look different enough to confuse them.
- Sensor fit. Your product relies on spectral sensors or machine-mounted cameras unlike those existing models were trained on.
- Deployment constraints. Inference has to run offline on specific edge hardware within tight power budgets.
- Output requirements. The product needs severity estimates or geolocated outputs that existing APIs do not return.
If several of these apply, a scoped discovery phase can show whether customization closes the gap before you commit to a full build.
How Beetroot Helps AgriTech Teams Build Computer Vision Capabilities
At Beetroot, we help AgriTech product teams develop custom computer vision capabilities for crop monitoring around their own imagery and product workflows. We adapt visual models to crop- and field-specific data and connect detection outputs to the platforms your users already work in.
Depending on the use case, our work can bring together computer vision development, data pipelines for computer vision systems, embedded software for edge AI, and MLOps for production AI models.
Agronomic judgment stays with your team and your customers’ advisors. Our focus is the technology layer that helps you validate a vision capability under representative conditions and improve it as production data changes. As part of our GreenTech software development work, our engineers can join your team or take ownership of a defined workstream.
Crop Disease Detection Works When the System Fits the Field
Successful AI crop disease detection depends on matching data, model task, sensors, deployment, and integrations to a concrete product requirement. Training data that resembles your customers’ fields, validated in those fields, tends to do more for the product than the latest architecture.
If you’re weighing whether your imagery and use case call for a custom approach, our team can help you review the data you already have and scope a focused pilot around it. Let’s talk.
FAQs
How does AI help with crop disease detection?
AI helps with crop disease detection by screening crop imagery for visible disease symptoms and locating affected plants across larger areas than manual scouting can cover. AI crop disease detection supports scouting decisions, and confirming the cause of the symptoms still requires agronomic review.
What data is needed to train an AI crop disease detection model?
An AI crop disease detection model needs labeled images that match production conditions, including the target crops, disease stages, seasons, and camera types. The training data should also include healthy plants and lookalike stresses, such as nutrient deficiency, so the model learns to tell them apart from disease.
How accurate is AI crop disease detection in real field conditions?
The accuracy of AI crop disease detection in real field conditions depends on how closely the training data matches the field, and it must be measured on held-out field images. A 2026 study in Frontiers in Plant Science found that a model with 99.73% accuracy on controlled leaf images reached 32.05% accuracy on field photographs.
Can crop disease detection run on edge devices without an internet connection?
Crop disease detection can run on edge devices without an internet connection when the model is optimized for the device’s compute and power limits. Edge deployment suits fields with weak connectivity, and results can sync to cloud platforms once a connection becomes available.
When does a custom crop disease detection system make more sense than an off-the-shelf model?
A custom crop disease detection system makes more sense when off-the-shelf models do not support the required crops, sensors, deployment environment, or output formats. Beetroot helps AgriTech teams adapt pretrained computer vision models to their own field data and integrate detection outputs into existing products.
Subscribe to blog updates
Get the best new articles in your inbox. Get the lastest content first.
Recent articles from our magazine



Contact Us
Find out how we can help extend your tech team for sustainable growth.