Renewable Energy Forecasting for Grid Operations: A Production Guide
- November 9, 2026
- 11 min read
- AI/ML
- Data
- Energy
- Green Tech

Contents
Contents
Most grid and energy software teams already have a forecast. The harder question is whether it predicts the right variable at the right horizon, and whether its performance holds when weather or asset conditions shift. This guide looks at forecasting renewable energy for grid operations as a production capability, from the data and models behind it to the validation and monitoring that keep it dependable.
Renewable Energy Forecasting and Load Forecasting Solve Different Problems
Renewable generation forecasting estimates how much electricity wind and solar assets will produce, while load forecasting estimates how much electricity customers will consume. Grid operations usually need both, because balancing decisions depend on the gap between the two. If you are mapping where forecasting fits among the software technologies renewable energy providers use, treat generation and load as separate modeling problems with their own inputs and error analysis.
Generation forecasting: how much renewable power will be available?
Generation forecasting translates expected weather into expected power output for a specific asset or portfolio. Solar power forecasting depends on solar irradiance, cloud cover, temperature, and panel orientation. Wind power forecasting converts wind speed forecasts into power. ENTSO-E describes that conversion as non-linear and shaped by terrain and wind farm layout, so small wind speed errors can become large power errors.
Live SCADA (supervisory control and data acquisition) telemetry and availability records then show which equipment is running. A turbine offline for maintenance changes output however good the weather forecast is, so treat availability data as a core input for both solar and wind.
Load forecasting: how much electricity will be needed?
Electricity load forecasting predicts consumption for a defined area or customer group from historical demand, weather, calendar patterns, and customer behavior. At the distribution level, energy load forecasting often draws on smart-meter data, which adds granularity along with gaps and privacy constraints. Rooftop solar complicates things further, because net-metered demand already has some local generation subtracted from it.
In utility load forecasting, one system may need to serve system-level grid load forecasting and customer-segment views at once. Decide which views matter before training anything, since that choice sets the data resolution your pipeline needs.
Net Load Connects Supply and Demand Forecasts
Net load is the demand that remains after variable renewable generation is subtracted, and net load forecasting links the two sides of the balance. The IEA’s framework for integrating variable renewables describes the gap between load and net load as minimal at low renewable shares and increasingly noticeable as they grow. The IEA’s Electricity 2026 report forecasts solar PV and wind rising from 17% of global generation in 2025 to 27% by 2030.
You can forecast net load directly or derive it from separate load and generation forecasts. Separate forecasts are easier to diagnose, since they show which side of the balance caused an error.
How does renewable energy forecasting work in practice?
A production forecast moves through a lifecycle: define the target, prepare the data, set a baseline, train and validate models, then deploy and monitor. The early steps deserve the most attention, because model choice and evaluation both depend on them.
Start With the Forecast Target and Horizon
Define what you are predicting before you choose a model: the variable, the aggregation level, how far ahead, and how often the prediction updates. A 15-minute forecast for one solar park and a year-ahead regional demand forecast are different products with different users.
The useful question at this stage is who acts on the forecast and when. If traders need a day-ahead position before a market deadline, a more precise forecast that arrives later has no value for that decision, so agree on accuracy requirements with forecast users for each horizon.
Build the Data Foundation Before the Model
Data quality often limits forecast performance before model architecture does. A production system typically combines four groups of inputs:
- Historical generation and consumption. The target history at the resolution you plan to forecast, with curtailment and outages flagged.
- Numerical weather prediction (NWP). Weather models that simulate the atmosphere forward in time and supply irradiance, wind speed, temperature, and cloud cover forecasts.
- Telemetry and smart-meter data. SCADA and IoT feeds that show what assets and customers are doing now; our overview of IoT data in clean energy systems covers where this data comes from.
- Asset and calendar information. Capacity changes, maintenance schedules, holidays, and clock changes that explain patterns weather cannot.
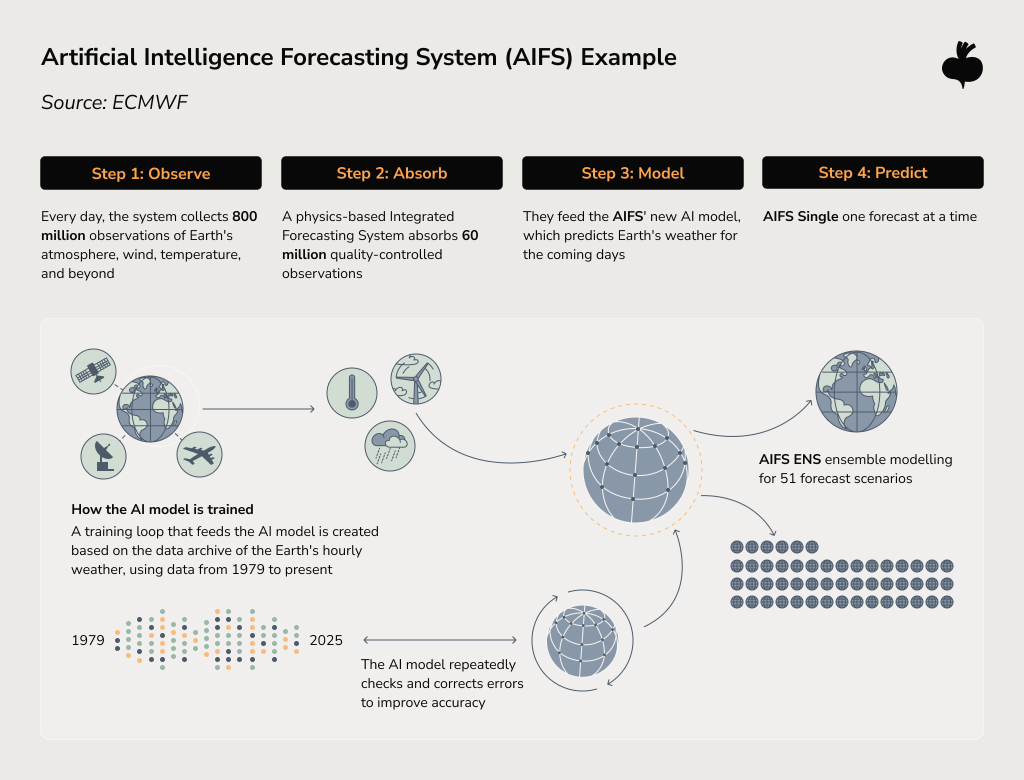
Weather inputs keep evolving. ECMWF put its AI-based ensemble forecast into operation in July 2025, and any new source like this comes with a short archive that limits how many seasons you can backtest it against. Weather feeds and meter data also tend to use different time zones and resolutions, and data engineering for energy forecasting helps align them before the mismatch shows up as apparent model error.
Establish a Baseline Before Adding Model Complexity
A baseline is the simple forecast a new model has to beat to justify its cost. Persistence, which assumes the next period will look like the current one, is the classic reference for very short horizons, and ENTSO-E notes it has been used as the reference point for judging new short-term methods. Seasonal averages or a tuned statistical model fit longer horizons. If a deep learning model improves only slightly on that baseline, the extra infrastructure and maintenance effort may not pay back.
Choosing Models for Renewable Energy and Energy Load Forecasting
The right model is the one that performs best on your validated data, at your horizon, within your operating constraints. No model family wins across every forecasting problem, so model selection works best as a structured evaluation.
Statistical Models Still Set a Strong Bar
Classical time-series forecasting methods, such as exponential smoothing and ARIMA-family models, remain strong choices for well-structured problems. They train quickly and are easier to explain to the operators who rely on them. For aggregated load with stable seasonal patterns, a statistical model can be the production answer.
Machine Learning and Deep Learning Earn Their Place Through Validation
Machine learning helps when weather, time, location, and asset behavior interact in nonlinear ways. Gradient-boosted trees handle mixed inputs such as weather forecasts and calendar flags well, while neural networks such as long short-term memory (LSTM) models can learn longer temporal patterns across many sites and need more data and monitoring in return.
Every candidate faces the same test: it has to beat the baseline in time-ordered validation by enough to cover its extra operating cost. If you are weighing custom machine learning models against an existing statistical setup, run both through the same backtest.
Ensembles and Hybrid Models Add Robustness Across Conditions
Ensembles combine several forecasts, and hybrid approaches combine physical and data-driven models. Both help when no single model performs consistently across seasons and weather regimes. In our renewable-energy forecasting case study, our engineers trained gradient boosting and LSTM models for 24–48-hour generation and demand forecasts and combined them in a hybrid approach. Each added component then needs its own monitoring.
Forecast Horizons Change What Counts as an Accurate Forecast
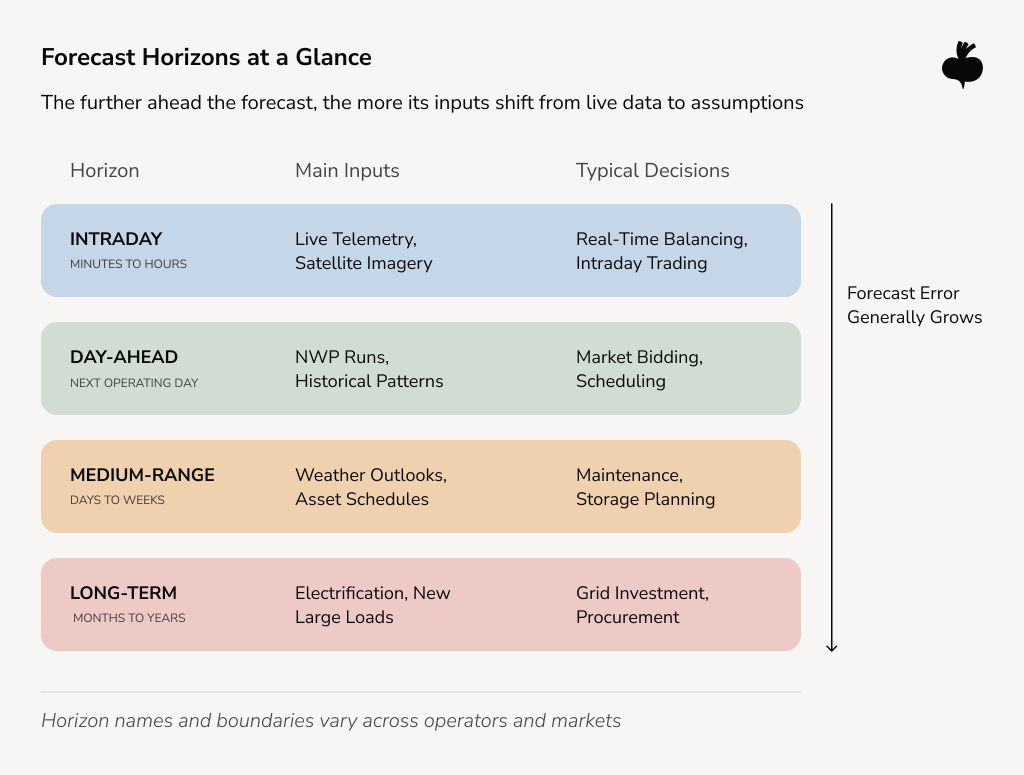
Forecast error generally grows with the horizon, and the most useful data shifts with it. ENTSO-E describes grid operators using wind forecasts 15–30 minutes ahead for near-real-time operations and 24 hours ahead for day-ahead market checks, while operational planning looks about 100 hours ahead. Terminology varies across markets, so read the groupings below as working categories.
Intraday and Very Short-Term Forecasts Rely on Fresh Telemetry
For horizons of minutes to a few hours, recent observations carry the most information. Live telemetry and satellite imagery add detail that weather model output rarely provides at this range, since NWP runs update only a few times a day. Intraday forecasting therefore depends on data latency as much as on modeling, so include feed delivery times in your requirements for short horizons.
Day-Ahead Forecasts Depend on Timing and Weather Runs
Day-ahead forecasting covers the next operating day and leans most heavily on NWP and historical patterns. The main constraint is timing, because forecasts must reach users before market or scheduling deadlines. Build your backtests around real gate-closure times, the deadlines for submitting market positions, so evaluation uses the weather run the model will receive in production.
Medium-Range and Long-Term Load Forecasting Support Planning
Days-to-weeks forecasts support maintenance and storage planning. Long-term load forecasting over months to years informs grid investment and procurement, where electrification and new large loads such as data centers matter more than next week’s weather. These forecasts are usually expressed as scenarios, so review the assumptions behind them as carefully as the historical fit.
What makes a renewable energy forecast reliable enough for production?
A forecast is ready for production when it beats a sensible baseline in time-ordered validation and holds up in the conditions that drive your decisions. A headline accuracy percentage cannot show either on its own, because it depends on the target, horizon, aggregation level, evaluation period, and metric behind it.
Validate Forecasts in Time Order
Backtesting replays history in time order, training only on information available when each forecast was made and testing against what happened next. Random train-test splits ignore that order, so the model can train on hours that come after the ones it is tested on. Because consecutive hours are strongly correlated, the test set then resembles the training data more closely than future data will, which tends to overstate performance. Rolling-window validation repeats the process across many forecast origins, an approach Hyndman and Athanasopoulos describe as evaluation on a rolling forecasting origin.
The important constraint: use archived weather forecasts as backtest inputs. Observed weather gives the model information it will never have in production and inflates its apparent accuracy.
Choose Error Metrics That Match the Decision
Choose the metric that reflects how forecast error costs your operation. MAE (mean absolute error) weighs errors linearly, in proportion to their size and is easy to explain in megawatts. RMSE (root mean squared error) penalizes large misses more heavily, which suits decisions where one big error hurts more than several small ones.
MAPE (mean absolute percentage error) becomes undefined or extreme when actual values are near zero, which makes it a poor fit for solar output in low-light hours. Normalizing MAE or RMSE by installed capacity keeps errors comparable across assets. Report at least two metrics by horizon, and agree with forecast users which one drives model selection.
Test the Conditions Where Error Matters Most
Average error can hide the periods when forecasts matter most, such as ramp events, when output rises or falls sharply within a short window. A comparison of Norwegian wind farm forecasts cited by ENTSO-E found two approaches with similar mean absolute error, and one performed better whenever moderate-to-large wind speed changes were forecast. Build stress-test windows from your own history, such as storms and seasonal transitions, and report them next to the overall score.
Show Uncertainty When a Single Number Falls Short
Probabilistic forecasting describes the range of plausible outcomes around a point forecast, which helps whenever the cost of being wrong is uneven. The model produces quantiles or scenarios, for example, a band between the 10th and 90th percentile of expected output.
The value shows up in decisions that trade off risk. An operator sizing reserves can act differently on a narrow band than on a wide one, even when the point forecast is identical. Weather ensembles are one practical input for these ranges. ECMWF’s AI-based ensemble runs 51 forecast variants, and the spread between them reflects the uncertainty in the underlying weather forecast on a given day, which your model can carry through to the power forecast.
Keeping Forecasts Reliable After Deployment
A forecasting service can stay online and keep returning numbers while those numbers gradually become less useful. Monitoring therefore answers two separate questions: whether the system is running, and whether its forecasts are still good enough to use.
Monitor the Data as Well as the Model
Input problems are often the first sign of forecast degradation. Watch for delayed weather runs, gaps in SCADA telemetry, timestamp shifts, and changing input distributions, and give asset changes such as a repowered wind farm their own alerts. Model drift, the growing mismatch between what a model learned and current conditions, often starts in the data. Data checks shorten detection time, but a flagged issue still needs investigation before anyone changes the model.
Track Forecast Error Where Averages Hide It
Forecast monitoring compares predictions with actual outcomes by horizon, asset, region, and season, since degradation in one segment can disappear inside a stable aggregate. BI dashboards that forecast users already open make those breakdowns easier to spot. Energy data analytics can then link forecast error to operational records, such as manual balancing interventions, helping your team judge whether a model change improved the workflow it was built for.
Retrain and Revalidate Deliberately
Retrain on an agreed schedule or when monitoring shows sustained degradation, including after structural changes such as new assets. A model can produce fresh predictions every few minutes while its learned parameters stay fixed, so you can set forecast frequency and retraining frequency independently. Before release, run each candidate through the same backtest and stress-test windows as the current model, and keep the previous version ready to restore.
The renewable energy project mentioned earlier reflects this approach, with backtesting and rolling-window evaluation before and after deployment, plus dashboards and retraining pipelines for seasonal and regional drift. After 12 months in production, the client reported a 10–12% reduction in manual grid balancing interventions and an 8% decrease in reserve energy purchasing costs.
When does custom renewable energy forecasting make sense?
Custom forecasting makes sense when your data or product requirements differ enough from standard services that the gap affects decisions. Otherwise, a commercial service is usually faster.
Use Existing Forecast Services When the Requirement Is Standard
Commercial providers and the forecasting modules inside energy management platforms work well when your geography and horizon match their offering and their output integrates cleanly with your systems. Renewable energy forecasting software from a vendor also brings the provider’s weather pipelines and operating history, and the same holds for load forecasting software bundled with a metering platform. Before committing, benchmark the vendor forecast against a simple baseline on your own data.
Consider Custom Models When Your Context Changes the Problem
Custom forecasting earns its cost when your context changes the forecasting problem itself. Typical signals include proprietary data a vendor cannot access, unusual aggregation levels such as rooftop solar across thousands of households, horizons a provider does not offer, and forecasts your customers see as a product feature. For a virtual power plant (VPP) provider, forecast quality can be a point of differentiation that is easier to improve when you own the model.
Evaluate the Production Capability Alongside the Model
A forecast delivered late or through an unreliable integration offers little operational value, no matter how strong its validation scores. When you compare options, look at:
- Data and model ownership. Who controls the inputs and the trained model if the provider relationship ends.
- Validation transparency. Whether you can see backtesting results by horizon and operating condition.
- Latency and integration. How forecasts reach your systems through APIs, and whether delivery fits your decision deadlines.
- Monitoring and retraining. Who detects degradation and how new versions are validated before release.
- Infrastructure and maintenance. What the cloud infrastructure for real-time data pipelines costs to run, and who maintains it.
How Beetroot Helps Build Production Forecasting Systems
At Beetroot, we help energy and GreenTech teams build forecasting capabilities around their own data, systems, and operating requirements, starting from the platform your team already runs.
Depending on the use case, our work can bring together time-series model development, predictive analytics, and data pipelines built for energy workloads, as part of our broader GreenTech software development practice. The result is a forecasting service your team can integrate and operate, with monitoring and retraining support scoped to your ownership needs.
Production-Ready Forecasting Starts With the Right Question
Reliable renewable energy forecasting comes from matching the target and horizon to the right data, then validating and monitoring the result with the same care as the model itself. A sophisticated model adds value when it beats a sensible baseline under the conditions your operations care about and stays monitored after launch.
Once dependable generation and load forecasting is in place, the next question is how systems and people act on those forecasts, which we cover in how AI agents use forecasts in grid optimization. If you’re reviewing an existing forecasting setup or planning a new one, our team can help you define the requirements and shape a production architecture around your data. Let’s talk.
FAQs
What is the difference between renewable generation forecasting and load forecasting?
Renewable generation forecasting estimates how much electricity wind and solar assets will produce, while load forecasting estimates how much electricity consumers will use. Grid operations often need both forecasts, and net load forecasting combines them to show the demand that remains after variable renewable generation.
What data is needed to forecast wind and solar power generation?
Wind and solar power forecasting relies on historical generation data combined with numerical weather prediction outputs such as solar irradiance and wind speed forecasts. Live SCADA telemetry and asset availability records improve short-horizon forecasts by showing which equipment is operating.
How should renewable energy forecasting accuracy be measured?
Renewable energy forecasting accuracy should be measured through time-ordered backtesting against a simple baseline, using error metrics such as MAE or capacity-normalized RMSE that match the operational decision. Results should be reported by forecast horizon and for difficult conditions such as ramp events, because a single average score can hide the periods that matter most.
How does the forecast horizon affect renewable energy forecasting?
The forecast horizon determines which data and models are most useful, since very short-term forecasts depend on fresh telemetry while day-ahead forecasts rely mainly on numerical weather prediction and historical patterns. Forecast error generally grows with the horizon, so accuracy targets should be set separately for each horizon.
When should renewable energy forecasting models be retrained?
Renewable energy forecasting models should be retrained on an agreed schedule or when monitoring shows sustained performance degradation, for example after new assets come online. Before release, each retrained model should be validated against the current production version through backtesting, with the previous version kept available to restore.
Subscribe to blog updates
Get the best new articles in your inbox. Get the lastest content first.
Recent articles from our magazine




Contact Us
Find out how we can help extend your tech team for sustainable growth.